With your daily membership you receive MARKET CHARTS commentary from one of the country's top Elliott wave analysts, Larry Tomlinson. Considered the 'best' by many professional stock and bond traders, Larry outlines in each nightly issue where the dominant support and resistance areas are in the Dow and S&P 500 indexes, - also where each market is going on both a short and intermediate-term basis and when it is likely to get there. Larry also incorporates a unique price-timespiral analysis into his methodology, identifying major turning points sometimes months in advance.
Larry's analysis is one of a kind and a real 'must have' on a daily basis if you are serious about timing today's markets. With your membership to our services you get it all - from Elliott-Wave, Gann, S/R tables, Spiral analysis, to market risk reports - all done using the most in-depth analysis that is available anywhere today.
Bond trader? Larry also offers a bond analysis service. For information on the bonds analysis you can contact him here.
To see a sample issue of Market Charts, click on the link below:
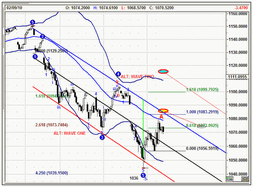
Larry uses detailed charts to illustrate his Elliott-waveforecasts, along with other proprietary technical methods. In his weekly commentary Larry outlines his market prospects for the longer term picture for each equity index and examines other markets of interest when applicable, such as gold, the Euro, Nikkei, etc - and how they relate to the U.S. markets.
Also included in each outlook are Larry's proprietary Support/Resistance tables, which he developed by after years of researching how market movements work. These tables can pinpoint accurately - many times to the exact point - where the market can stall and reverse or find support or resistance. They are an
term timer or a daytrader trading the S&P futures. The support/resistance tables form much of the basis behind Larry's work. If you are a serious trader these tables are a necesity to determine where critical supply and demand exist.
invaluable tool, especially if you are a short-term